
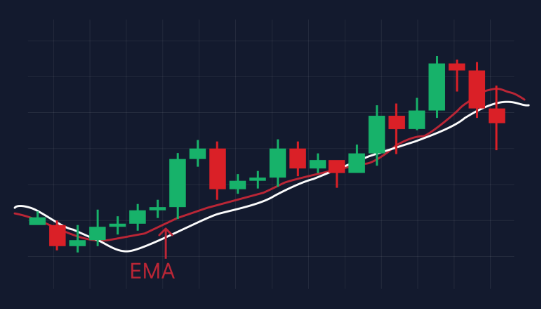
When it comes to trading, the tools that help us make decisions can be the difference between profit and loss. Among these tools, the EMA Indicator stands out due to its effectiveness in tracking trends and identifying entry and exit points. So, if you’re keen on refining your trading skills, let’s dive into what the EMA Indicator is, how it’s calculated, and how traders like you and me can use it effectively.
What is the EMA Indicator?
The EMA Indicator, or Exponential Moving Average, is essential for traders. Unlike the simple moving average, which calculates the average price over a fixed number of periods, the EMA Indicator gives more weight to recent prices. This means it reacts faster to price changes, making it a popular choice for many traders.
Why does this matter? Well, the quicker the moving average responds to price changes, the more relevant it is for trading decisions. For instance, if there’s a surge in price, an EMA Indicator can help you detect the shift more promptly than other indicators.
The Calculation: How the EMA Works
Now, let’s tackle the calculation part without diving deep into complex math. Imagine you’re making a smoothie. You need to blend fresh fruits to get the best mix. Similarly, the EMA Indicator blends price data, but it prioritizes newer prices.
Here’s a simple breakdown of how it works:
1. Determine the time period: Commonly, traders look at the last 10, 20, or 50 days. The longer the period, the smoother the EMA.
2. Calculate the multiplier: This is where it gets a bit technical, but stay with me! The multiplier formula is 2 divided by (the number of periods + 1). For example, if you choose a 10-day EMA, the multiplier would be 2 / (10 + 1), which equals approximately 0.1818.
3. Start with an SMA (Simple Moving Average): For the first EMA value, you need the SMA of your chosen period.
4. Apply the EMA formula: Once you have the first SMA, you calculate subsequent EMAs using the following formula:
CurrentEMA=(CurrentPriceMultiplier)+(PreviousEMA(1-Multiplier))
Sounds complicated? Don’t worry; you can find most trading software will do this for you!
Importance of the EMA Indicator in Trading
Let’s discuss why the EMA Indicator is essential for traders. In stock trading, identifying trends is like finding the right wave to ride when surfing. You want to catch the upward momentum to maximize profits and avoid the downward trends that could wreck your trading ship.
1. Trend Detection: The EMA Indicator helps in spotting trends early. If the price is consistently above the EMA, there’s a strong upward trend. If it’s below, that could indicate a downward trend.
2. Dynamic Support and Resistance: EMAs are also useful as dynamic support and resistance levels. Traders often look for price rejections when the stock approaches these levels. Think of it like a trampoline; it can bounce back if it approaches but doesn’t break through sufficiently.
3. Signal Generation: When the price crosses above the EMA Indicator, it can signal a buying opportunity. Conversely, if it crosses below, that often suggests it’s time to sell or do some serious risk management.
How Traders Use the EMA Indicator
So, you might wonder, how can traders actually utilize the EMA Indicator? Well, let’s break this down with relatable scenarios.
Strategy 1: The Crossovers
One of the most popular strategies involves using two EMAs of different lengths. For example, you could use a 50-day EMA and a 200-day EMA. When the shorter EMA crosses above the longer one, it’s commonly known as a “golden cross,” which signals a potential long position. On the other hand, if the shorter EMA crosses below the longer one, that’s often called a “death cross,” indicating it might be time to exit or shorten your position.
Strategy 2: The Convergence
The market always tries to confuse us, right? Well, using the EMA Indicator can help navigate that. When the price approaches the EMA Indicator but holds above it, it can be a good sign to enter a trade. This often indicates the strength of the upward trend.
Strategy 3: Swing Trading
For swing traders, the EMA Indicator can serve as a great tool to identify potential reversals. They often look for scenarios where the price touches the EMA after a trend, indicating a possible reversal point. Like hitting the sync button on your playlist, you just know it’s time to make a move.
Strategy 4: Filter for Other Indicators
Incorporating the EMA Indicator with other trading indicators can enhance your strategy. For instance, combining it with the VWAP Indicator (Volume Weighted Average Price) will allow you to compare price trends concerning trading volume. The VWAP Indicator is particularly helpful for determining the strength of price action, and can give context to whether you should trust a signal produced by the EMA Indicator.
Limitations of the EMA Indicator
Though the EMA Indicator is powerful, it’s important to recognize its limitations as well. First off, it can generate false signals, especially in volatile or choppy markets. So, while it offers quick reactions to price changes, you might want to use it alongside other indicators to confirm your strategies.
Another point to consider is that the EMA’s sensitivity can be both a blessing and a curse. If the periods are too short, it may react too quickly to market noise. So, finding the right balance is key!
Conclusion: Embrace the EMA Indicator
In the ever-evolving world of trading, the EMA Indicator stands as a crucial tool in your arsenal. Its ability to provide insights into trends, support and resistance levels, and potential entry or exit points can significantly influence your trading strategies.
By understanding its calculation and being aware of both its strengths and weaknesses, you can better navigate the complexities of trading. Whether you are just starting or have years of experience, the EMA Indicator can help illuminate your path in the trading journey.
So, next time you’re sitting down to analyze the market, emphasize the importance of the EMA Indicator. It might just become your new favorite tool in your trading toolkit!