
The traders in the rapid markets usually need an instrument that will provide them with precise and prompt information about the price fluctuation in a short time period. The TradingView charts are a good way of monitoring the high-frequency market trends, and this tool will allow the user to observe the tick-by-tick price movements, trend and volatility of a particular stock market. Through these rapid changes, traders can identify the opportunistic times, measure momentum and make rapid and precise decisions.
HFT analysis involves a study of the price dynamics of extremely brief timeframes. TradingView charts enable traders to follow one-minute responses, five-minute responses, or even tick-level responses, monitoring how prices respond to order flows and news on the market. Marking the charts with critical levels, price spikes, and reversal points creates a visual guide that can assist traders to operate in a more lucid market dynamism.
Volume is a very important element in tracking high-frequency movements. Sharp changes in price are usually followed by or coincide with sudden increases in trading volume. Traders can overlay both the volume indicators and the price action using TradingView charts to get an idea of these changes, to predict how the price might break out or reverse. Such a combination of volume and price monitoring improves accuracy and timeliness in trade.
Short-term analysis can be supplemented with technical indicators. VWAP, moving averages, RSI, and Bollinger Bands are tools that allow traders to determine how strong the trend is, whether it is overbought or oversold, and whether it will be volatile in real time. Placing these indicators on TradingView charts gives the trader a multi-dimensional perspective of the market, enabling quicker and more informed decisions when the market is busy.
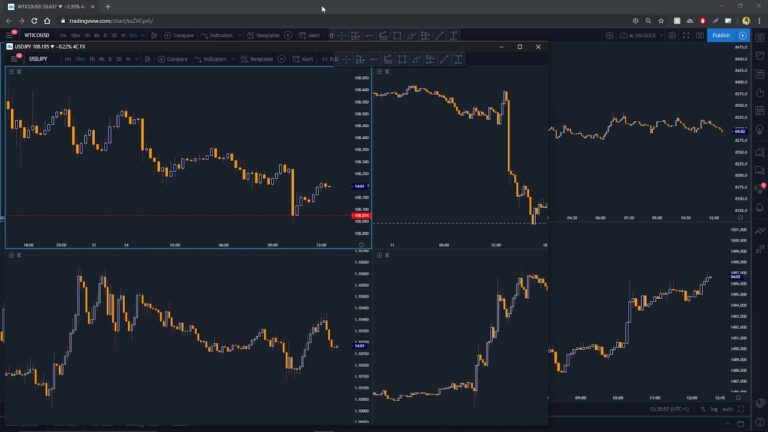
The analysis of high frequency is made more expressive by tracking multiple timeframes. Although one-minute charts ensure that price changes are recorded within a minute, a slightly longer time period presents the bigger picture with respect to the current trend. Comparing various periods using TradingView charts will ensure high-frequency plans are more reliable since they will not be implemented using micro-movements, which could be inconsistent with the overall short-term trends.
TradingView chart alerts improve reactions to volatile settings. Traders can configure alerts for price changes, volume breakouts, or indicator triggers to respond instantly to emerging trades. This can be achieved through visual analysis of charts and automated alerts to allow the traders to be in charge of the market trends without the need to constantly monitor the screens, to assist in disciplined trading and risk management.
The patterns of the past offer more information in the development of strategies because they are in high frequency. Watching history periods of rapid-price movement many times and tagging them to TradingView graphs will enable the trader to observe repeat setups, common reactions, and risk regions. This type of systematic review can help to optimize the plans in terms of entry and exit and recommend how fast the stop-loss and take-profit settings can be modified to the activity in the market.
A system of tick-level price monitoring, volume analysis, technical indicators, multi-timeframe analysis, alerts and the historical analysis of patterns TradingView charts gives a methodical way of trading in a high-frequency market. This systemic approach enables traders to anticipate price volatility within a short period of time, make correct trades, and deal with risk with certainty in the high-frequency trading environment.